EMK - Access the monitoring stack
Estimated time to read: 2 minutes
Effective monitoring is essential for maintaining the health, performance, and reliability of your Kubernetes infrastructure. With EMK (Enterprise Managed Kubernetes), you get built-in monitoring capabilities powered by Plutono, giving you comprehensive visibility into your cluster's metrics, resource usage, and application performance.
This guide will walk you through the process of accessing your monitoring stack through the Cyso Cloud dashboard. Once connected, you'll be able to explore a range of pre-configured dashboards that provide real-time insights into your cluster's operations, including node performance, pod statistics, resource consumption, and much more. You can also forward these metrics to your own observability platform or collect them with your own collectors. More information on that here.
Whether you're troubleshooting issues, optimizing resource allocation, or simply keeping an eye on your infrastructure, the monitoring stack gives you the tools you need to make informed decisions. Follow the step-by-step instructions below to access Plutono and start exploring your cluster's monitoring data.
If monitoring is enabled in your Kubernetes Cluster, you can access the Plutono setup by following these steps:
Navigate to the EMK Cluster overview in the Cyso Cloud dashboard.
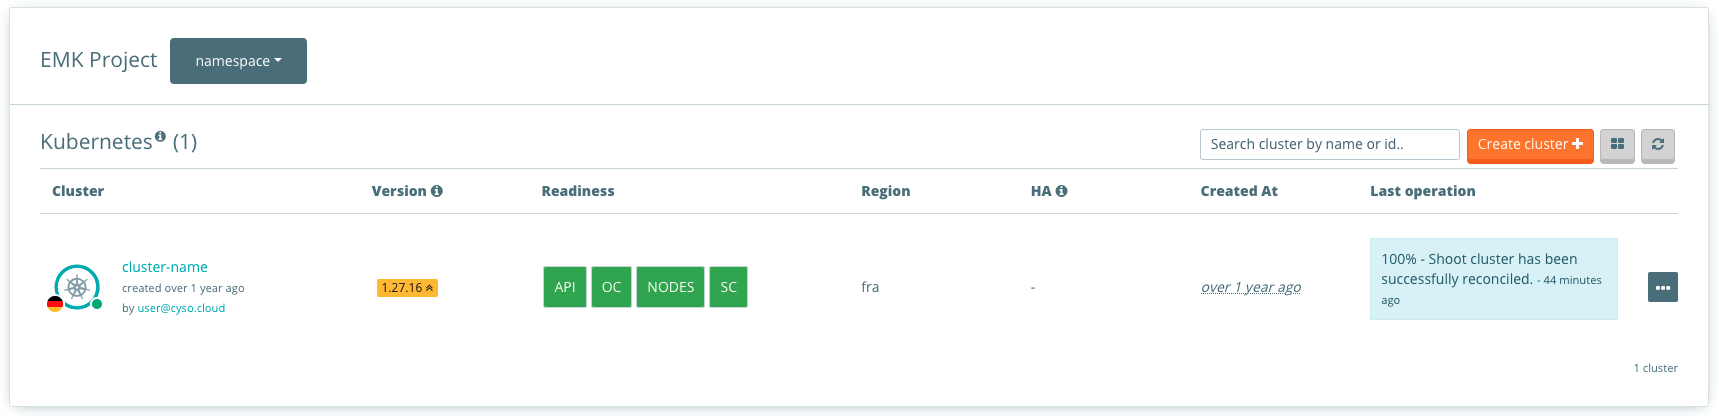
Select the corresponding cluster and find the Logging and monitoring.
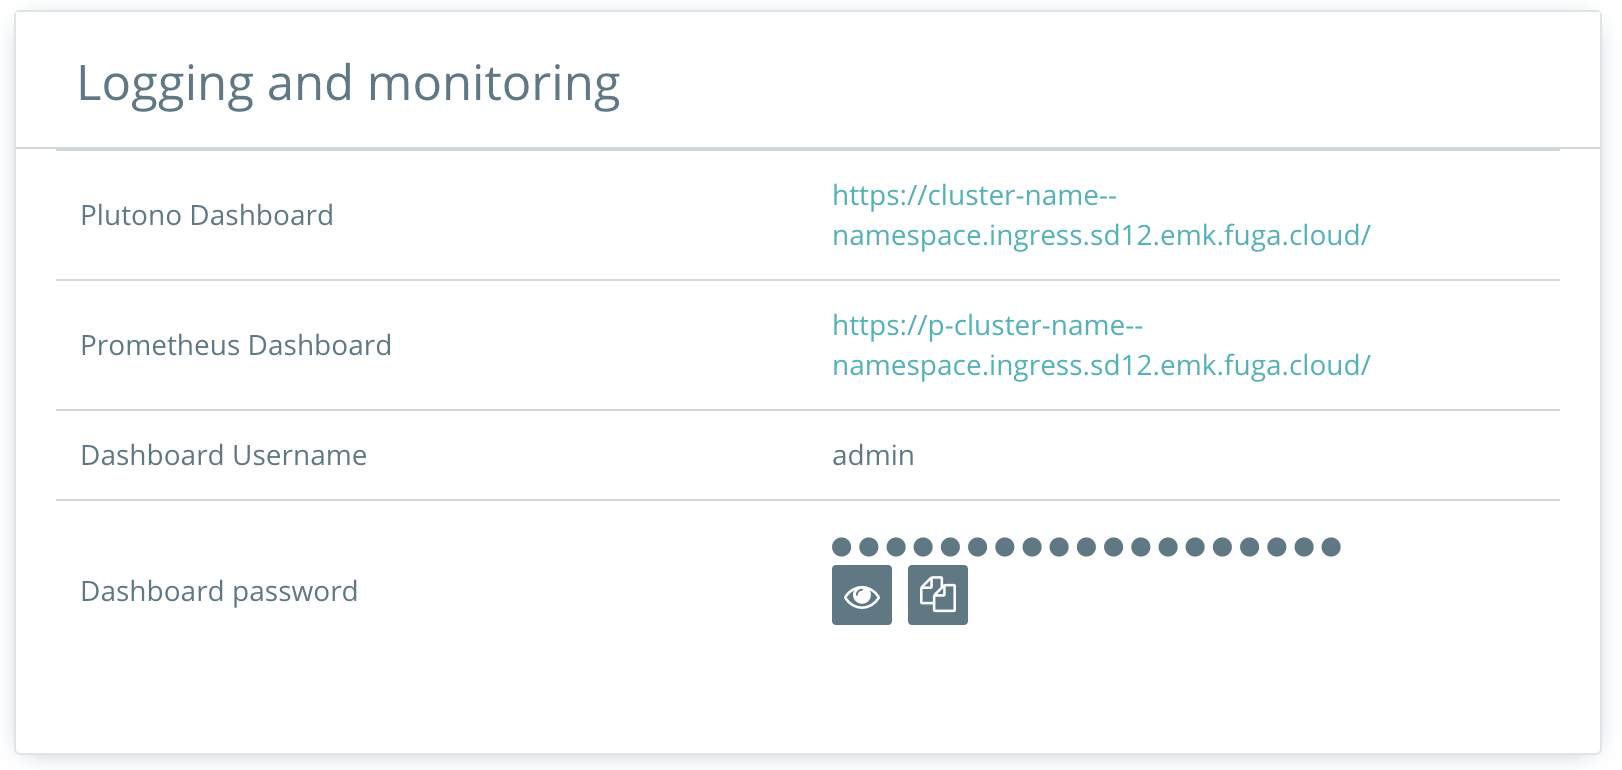
Access the Plutono credentials. Then visit the Plutono link and copy the credentials by clicking on the respective button.
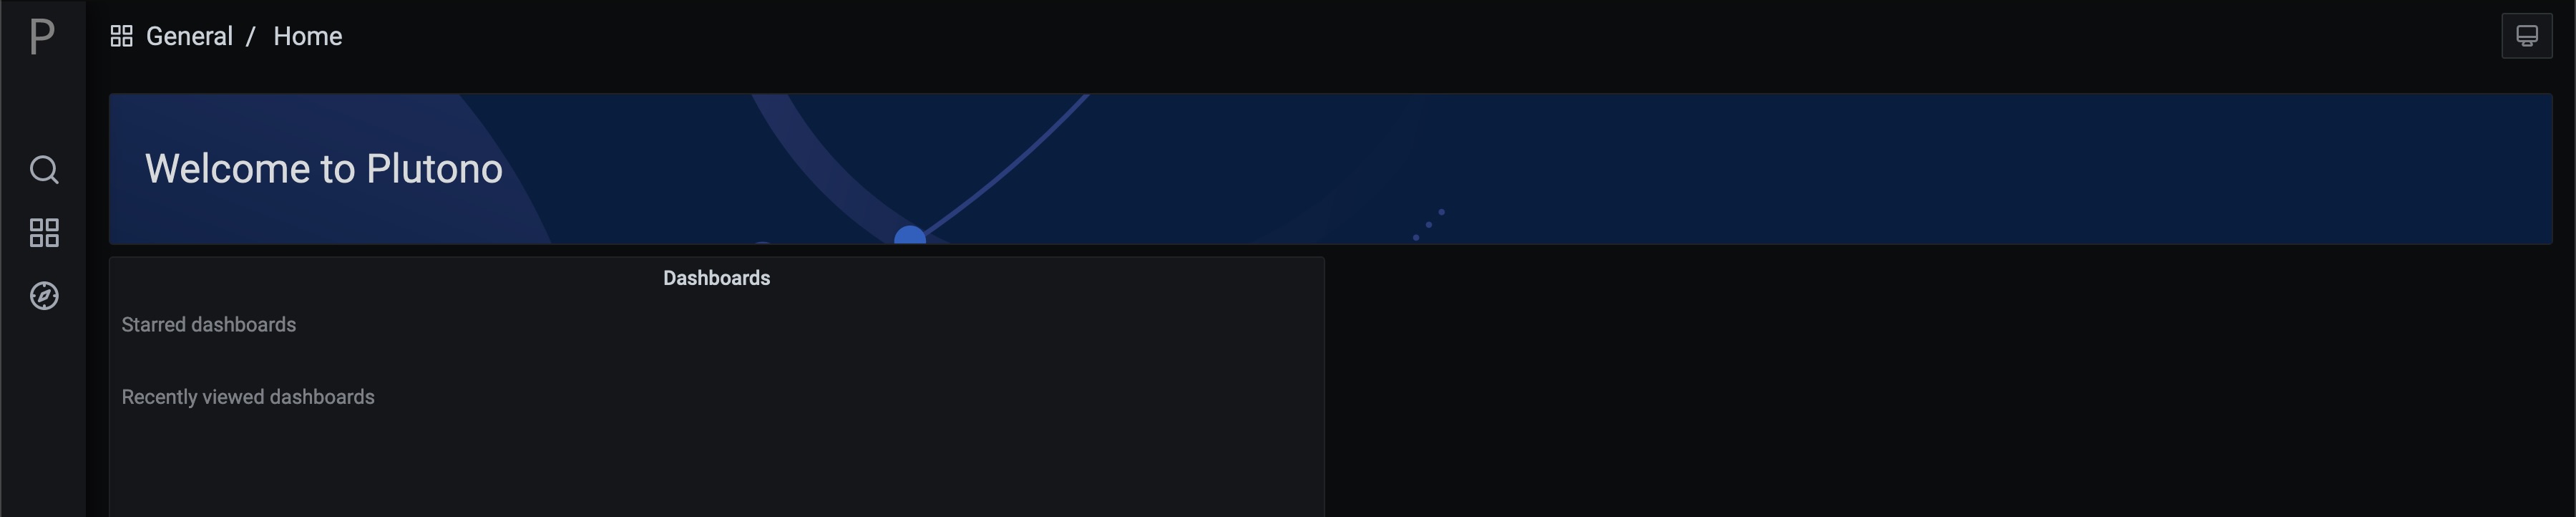
This will give you access to the Plutono environment.
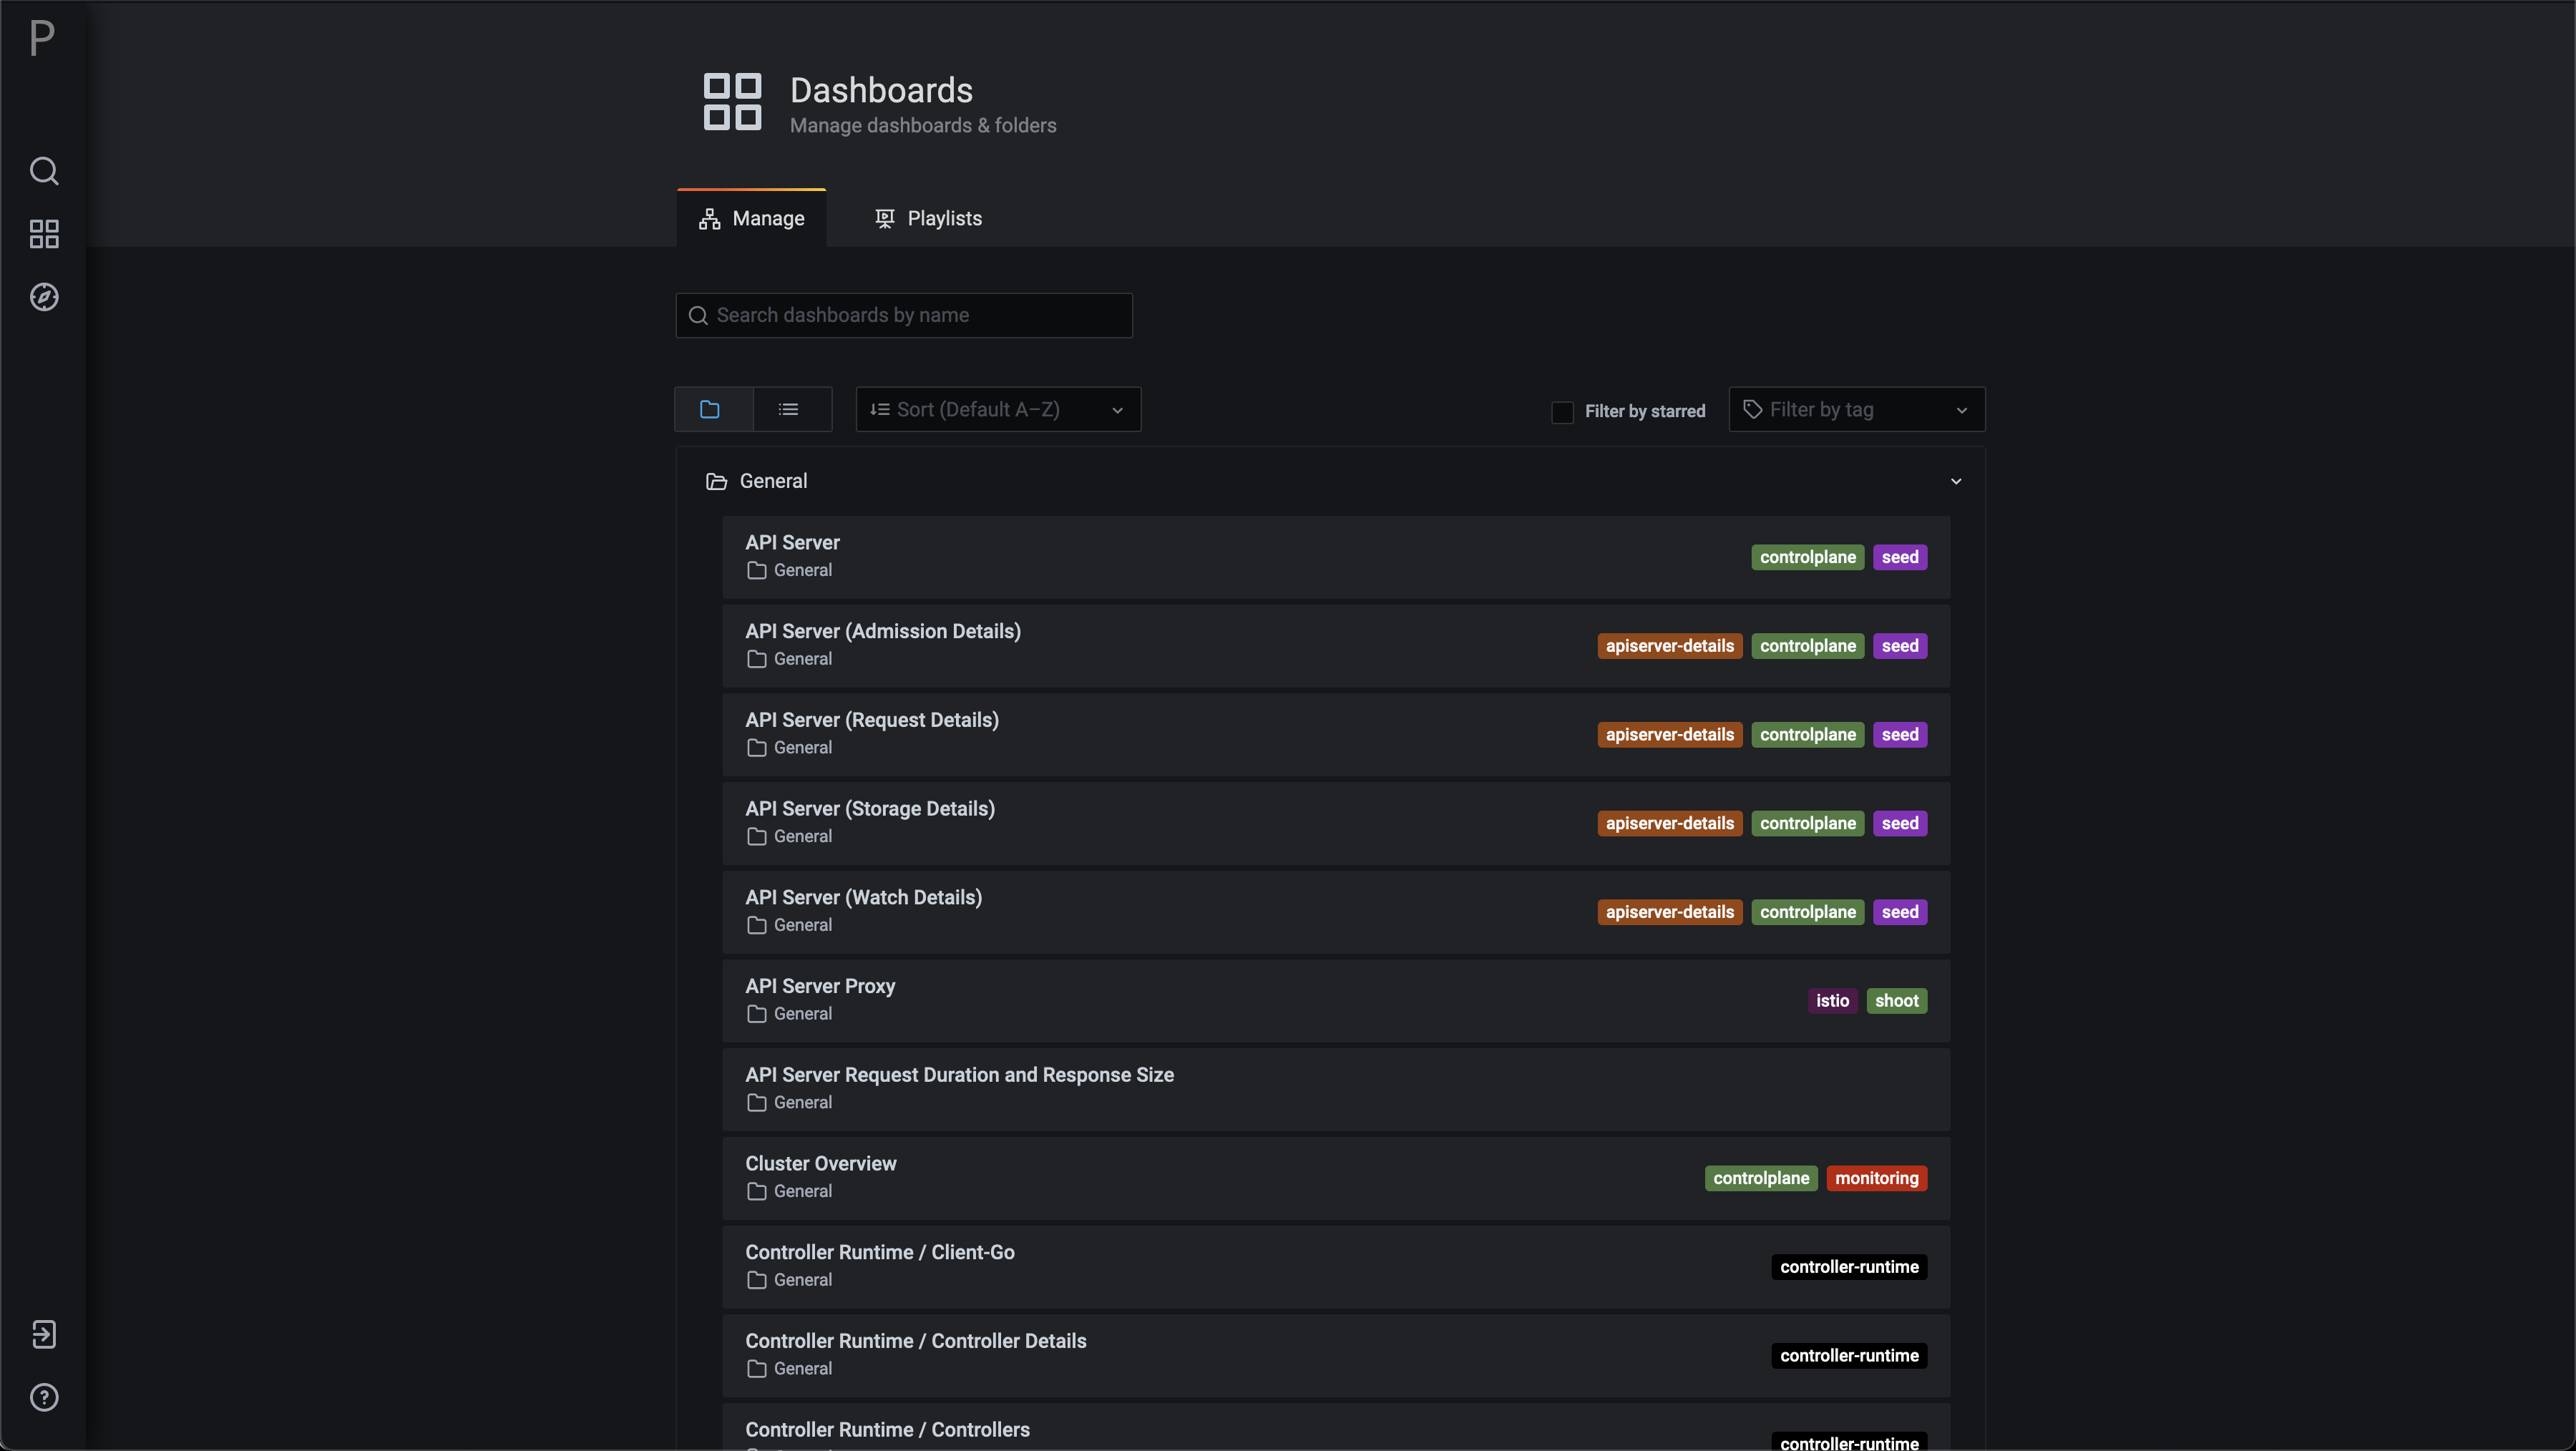
Then click on the 4 boxes in the left sidebar -> Dashboards -> Manage. This will give an overview of all the available dashboards.